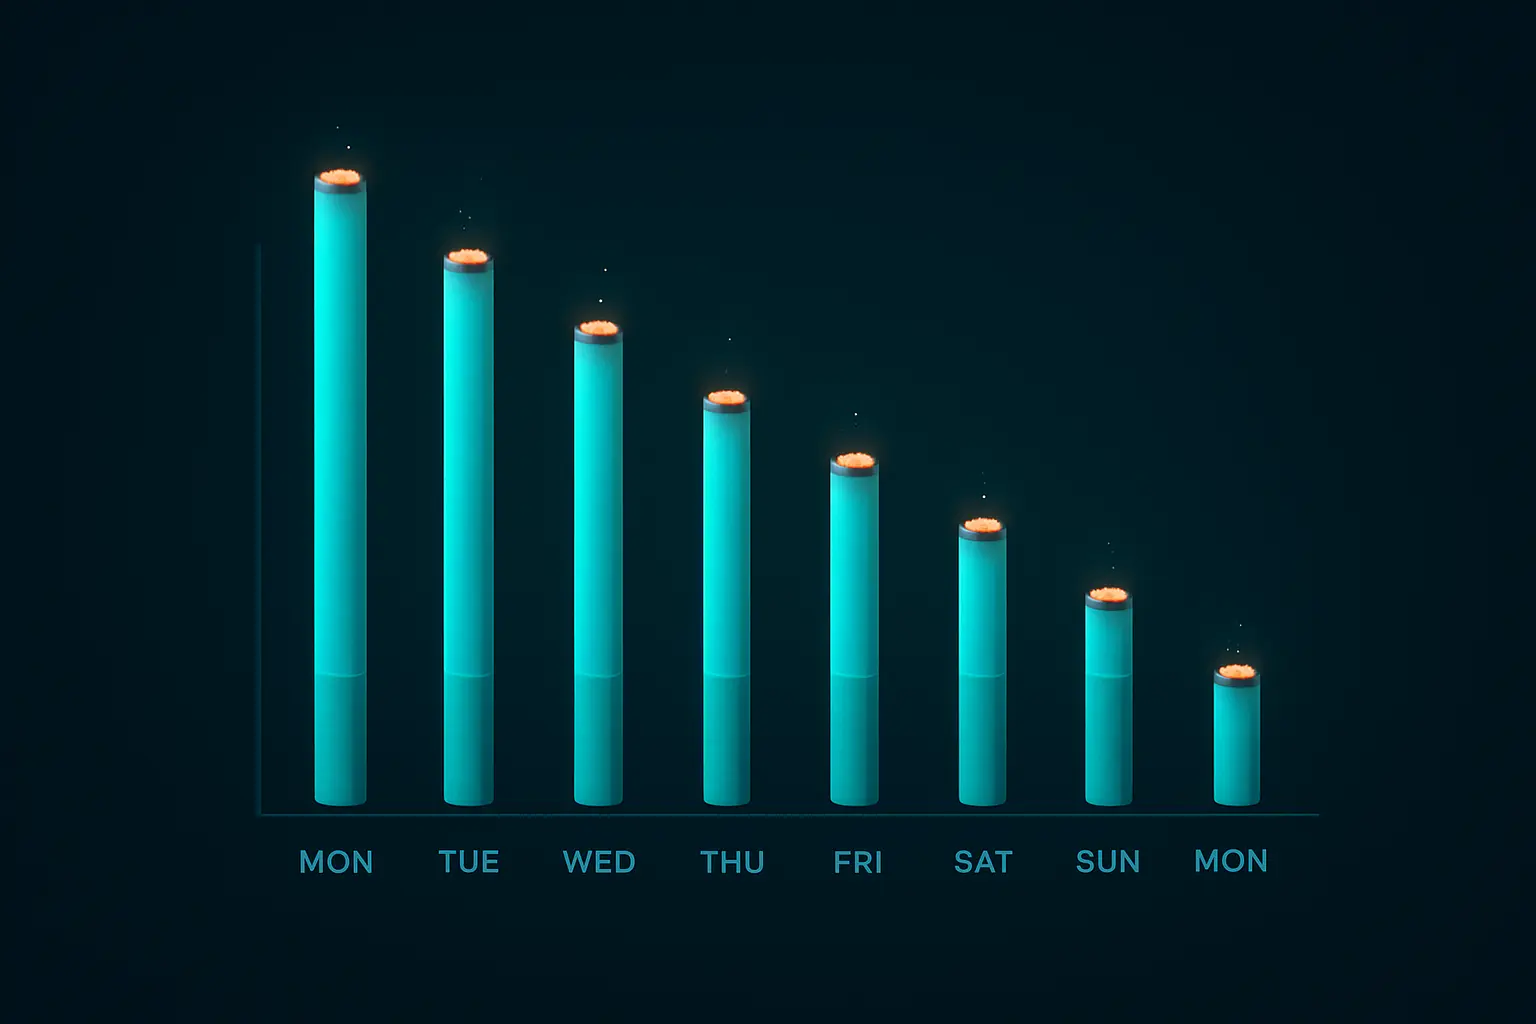
Here’s the number nobody tells new quitters: in week one you’ll face roughly 3–6 strong cravings per day — and each peaks for only 3–5 minutes. Do the arithmetic and the hardest week of quitting contains under 30 minutes per day of acute difficulty. The dread of quitting imagines a 24/7 siege; the data describes short, survivable, countable waves — on a curve that falls fast.
The craving-frequency curve
| Period | Strong cravings | Character |
|---|---|---|
| Days 1–3 | 4–6+ per day | Withdrawal peak; urges arrive unprompted plus at every ritual cue |
| Days 4–7 | 3–5 per day | Nicotine gone from the body; cue-triggered urges dominate |
| Week 2 | 2–4 per day | Shorter peaks; background restlessness fading |
| Weeks 3–4 | 1–2 per day | Mostly tied to specific triggers (coffee, alcohol, stress) |
| Month 2 | A few per week | Predictable contexts only |
| Month 3+ | Occasional | Rare cue-driven flickers; weaker each time |
Numbers are drawn from ecological momentary assessment studies — research where quitters log urges in real time — and they vary with dependence level: heavier smokers (25+ cigarettes/day) start at the top of each range. The shape of the curve, though, is universal: steeply down.
Not all cravings are equal: the two types
- Withdrawal cravings (days 1–7): chemistry-driven, arrive unprompted, fade as receptors down-regulate. These end. See how long nicotine cravings last for the duration data.
- Cue cravings (week 2 onward): fired by contexts — coffee, driving, drinks, stress. Momentary-assessment research finds most quitters have 3–4 predictable trigger windows per day, meaning your “random” cravings mostly run on a schedule you can map and pre-empt.
Why counting your cravings shortens them
Logging urges isn’t busywork — it changes the fight in three measurable ways:
- It converts dread into data. “Constant cravings” becomes “four today, down from six on Monday.” Progress becomes visible mid-struggle.
- It reveals your schedule. A week of logs exposes your personal trigger windows, so defenses (a walk, gum, the 3-minute protocol) can be scheduled instead of improvised.
- It builds a success rate. Every logged-and-beaten craving is evidence against the “I can’t do this” narrative — and quitters’ logged success rates are consistently higher than they’d guess.
The free iQuit app automates all three: one-tap craving logging with intensity and trigger, a personal success-rate dashboard, and — once about two weeks of data accumulate — predictive alerts that warn you 15 minutes before your usual trigger hours. Your craving curve stops being a statistic and becomes your own falling graph.
What bends the curve faster (and slower)
- Faster: exercise (acutely reduces urge intensity), consistent sleep, mapped triggers with planned counters, NRT or medication where appropriate.
- Slower: alcohol (top slip catalyst), “just one” experiments — a single lapse re-sensitizes receptors and visibly resets the frequency curve — and untreated stress. The relapse statistics show exactly where these risks concentrate.
FAQ
How many cravings a day is normal in week one?
Three to six strong episodes daily is typical, plus milder restlessness. Heavier smokers trend higher.
How long does each craving last?
The peak: 3–5 minutes. Even the worst week totals under half an hour of acute craving per day.
When do cravings stop?
Regular urges largely end by months two to three; rare cue-triggered flickers can persist longer but weaken every time.
Do cravings mean my quit is failing?
The opposite — they’re the extinction process running. A craving survived is a cue weakened.
Start counting your curve down: get iQuit free on Google Play — log cravings in one tap and watch your personal graph fall.